What do you learn at IDDS? Ask the data.
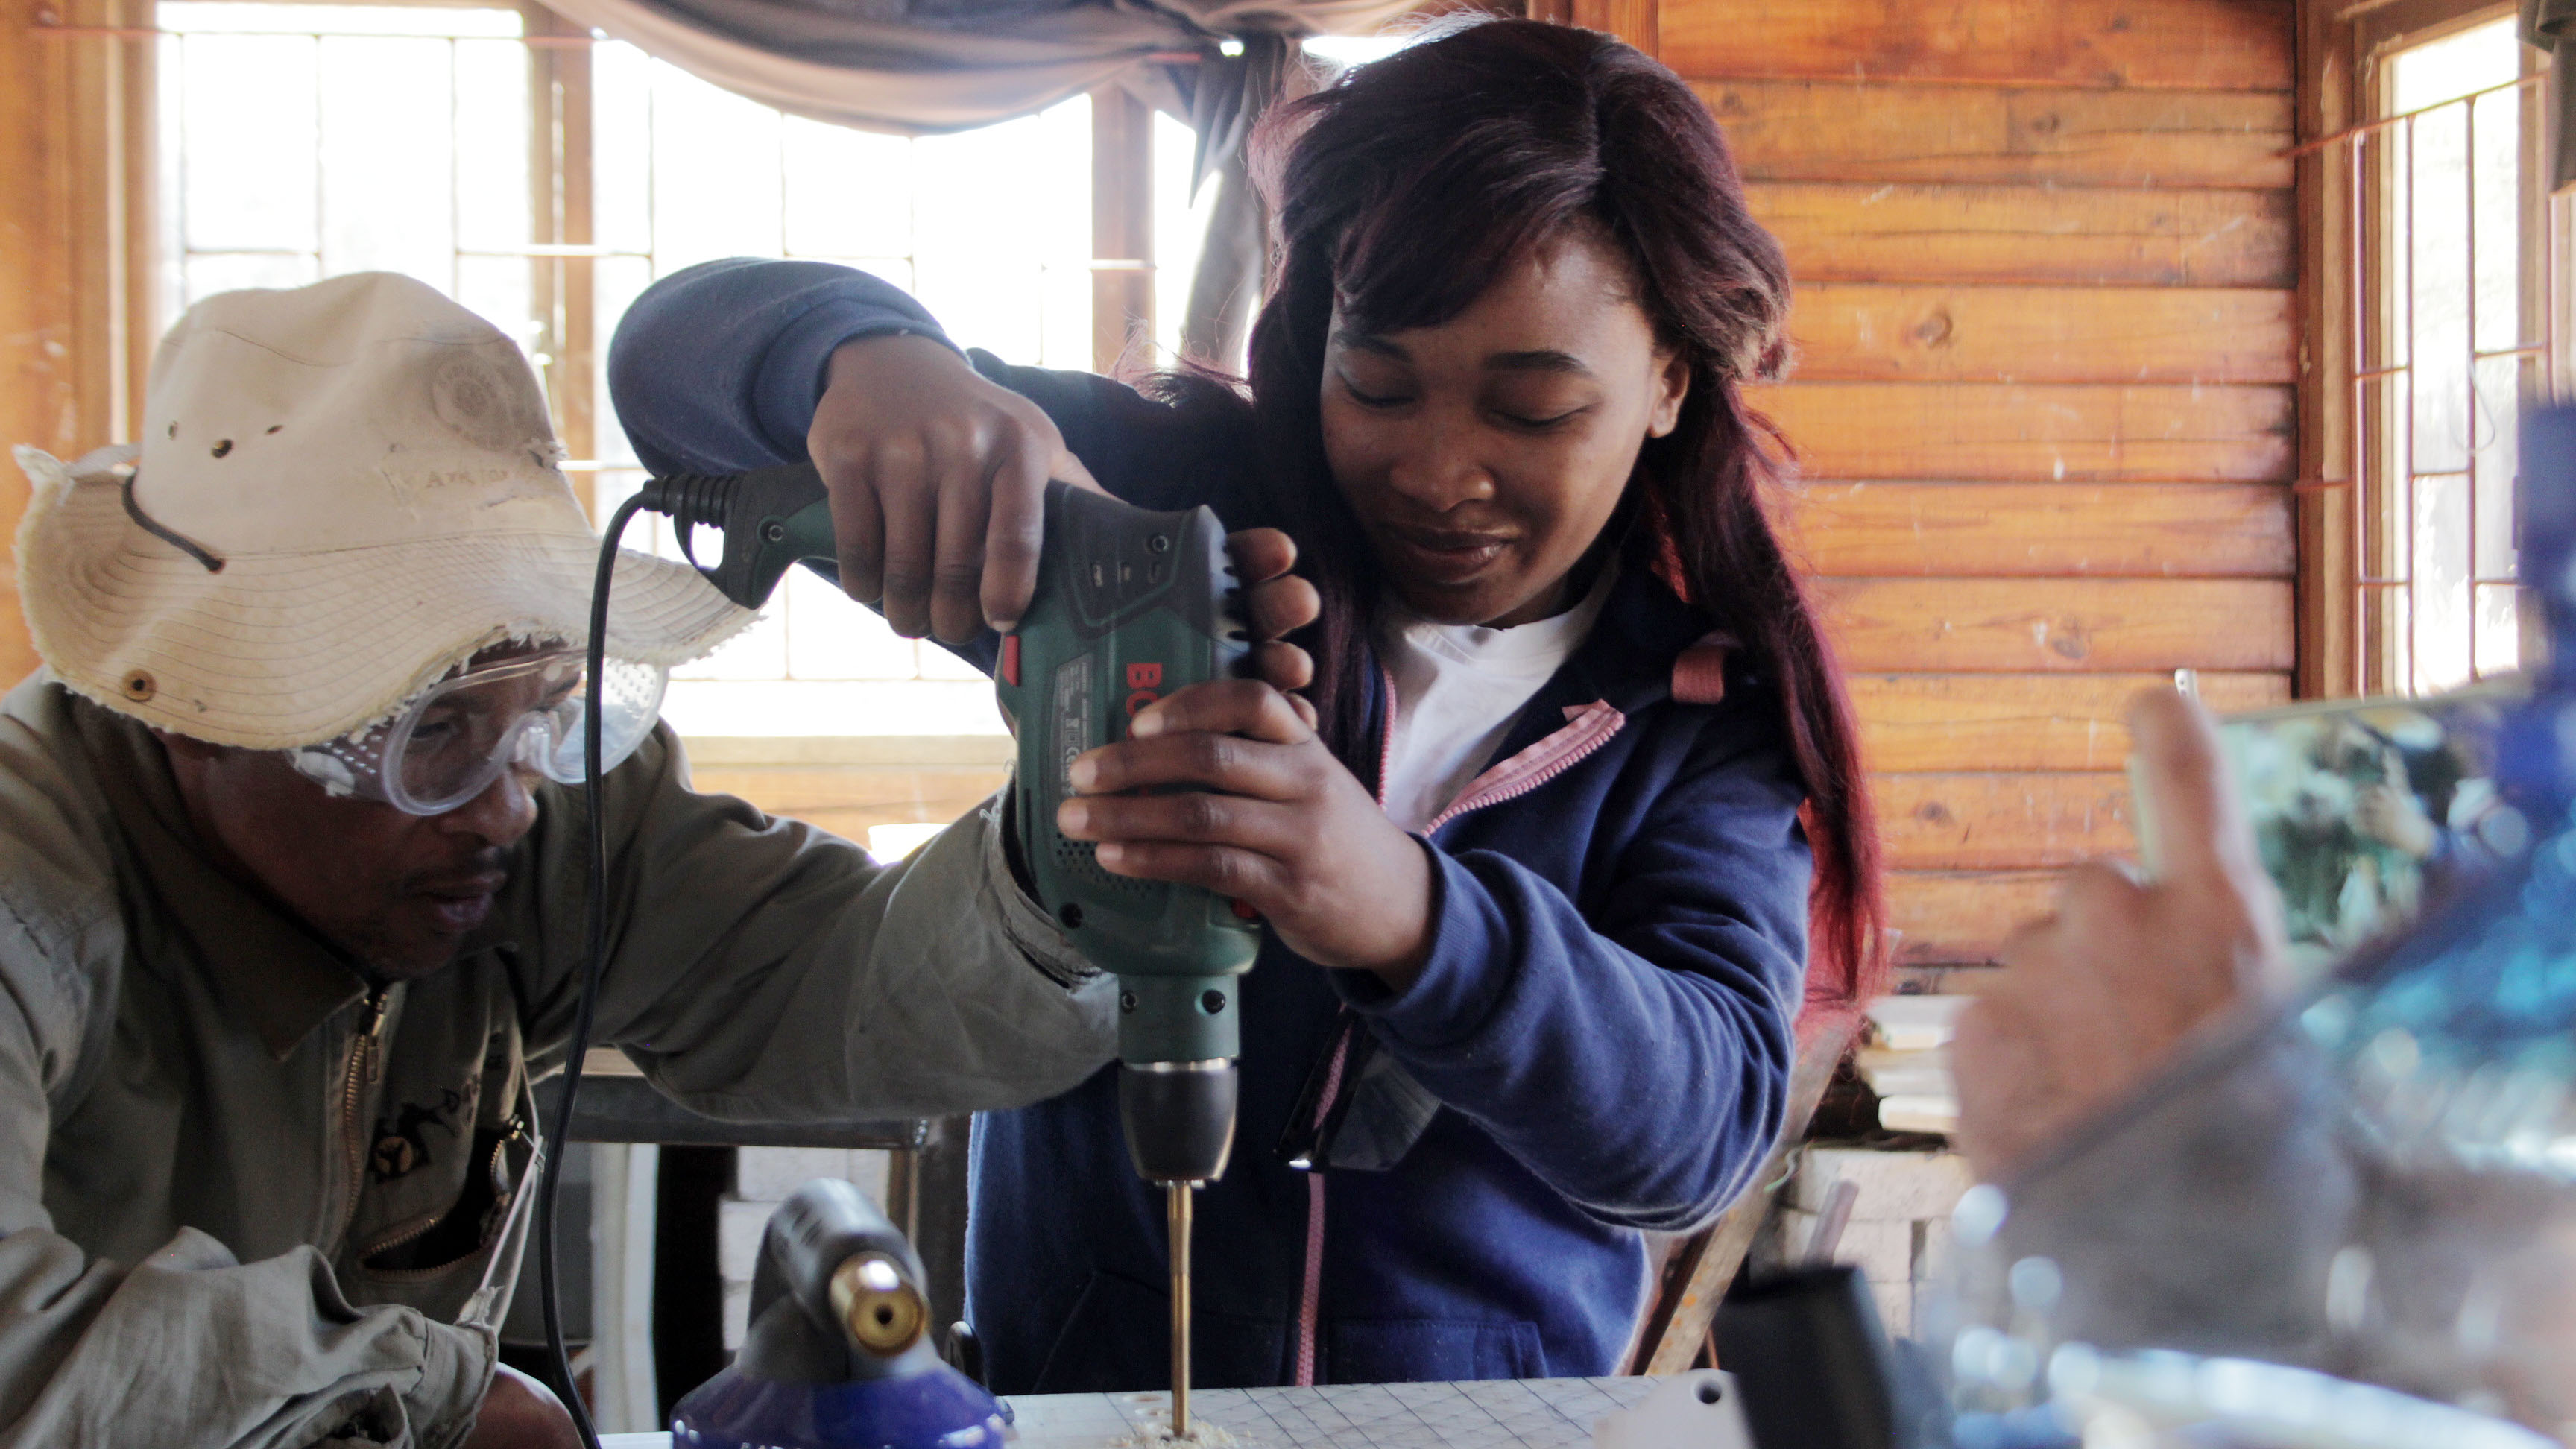
At IDDS Botswana, participants practice using tools during Skill Builders.
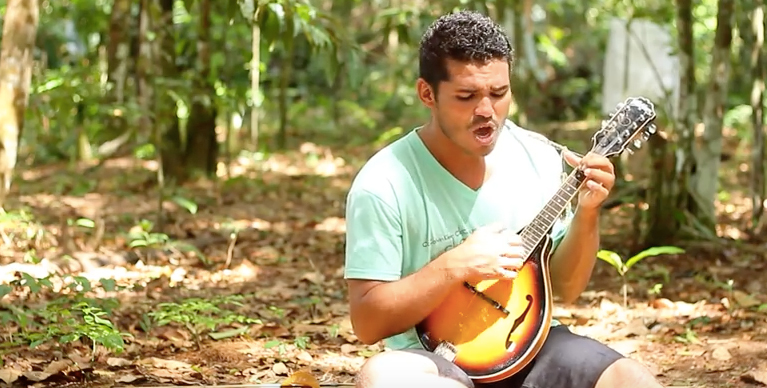
At the end of each International Development Design Summit, we ask participants to reflect on what they learned over the course of the summit. Their responses are as diverse as the participants themselves:
“I've learned how to use the chop saw and angle grinder.”
“I have learned how hard it is to frame a problem correctly, to define a problem in such a way that it is solvable.”
“Designing with a sense of reality. Scarcity in material, constraints in accessibility, etc. make a huge difference in the design process; something I have never worked with in these extremes before.”
"I feel I gained leadership skills throughout this process - how to assess the strengths of your team, and how to keep everyone involved.”
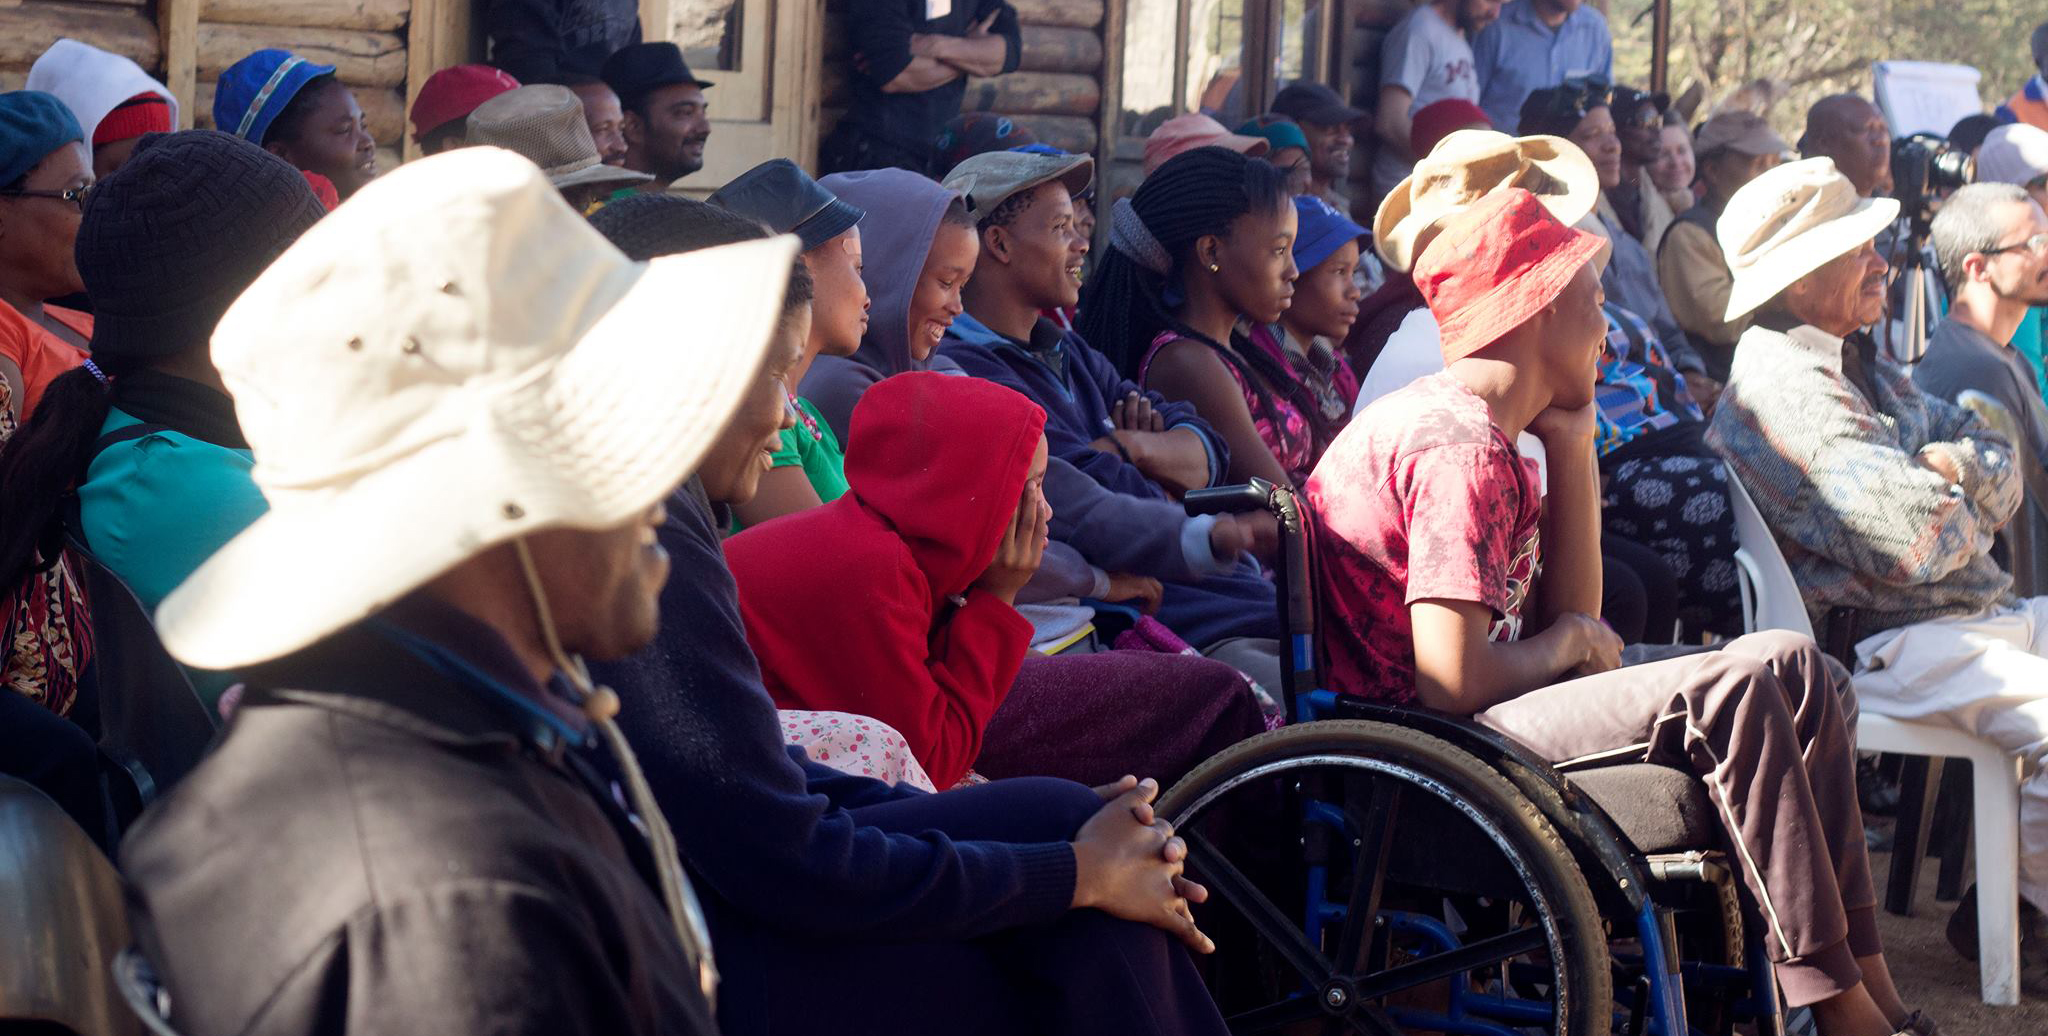
Anyone who has been to an IDDS knows that a lot is packed into a few short weeks. Participants get practice in hands-on building, an introduction to the design process, an experience co-creating solutions with users, and long hours working in cross-cultural teams. IDDS organizers hope that participants leave equipped with the skills they need to keep solving problems long after the summit is over.
So, what are they really learning? If so, where do they improve the most? Does everyone learn the same things? And how would we even measure that?
This past summer, we decided to give it a try. At the end of each summit, we asked participants to assess how confident they felt doing a range of different activities before and after the summit. They ranked themselves on a scale of 1-5, where 1 was “Not at all confident” and 5 was “Very confident.”
“How confident did you feel doing the following activities before and after IDDS?”
We asked this question to 130 IDDS participants from IDDS Educación, IDDS Amazon, IDDS Botswana and IDDS Cookstoves. Here’s what they said:
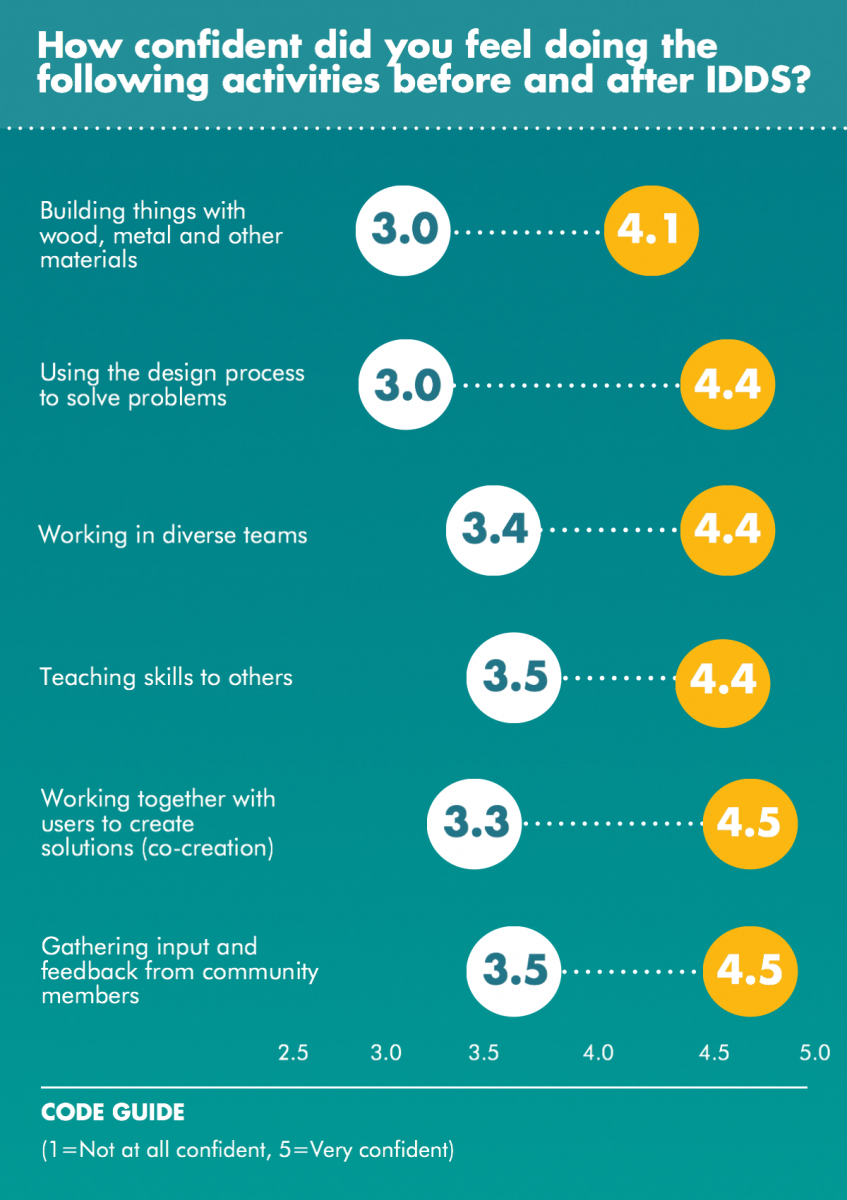
When I look at this graph, I notice a few things.
One, IDDS participants started out with lowest levels of confidence in building and design, while they had already come in with higher levels of confidence in the “soft” skills related to collaboration and teamwork.
Two, participants felt the biggest improvement in using the design process and co-creating with users. This is great news, not only because these are the main focuses of the IDDS curriculum, but also because our goals analysis showed that improving co-creation and design skills were participants’ top two priorities.
Three, by the end of the summit, participants still felt less confident in building than in the other topics. This may be due in part to the relative time allocated to teaching technical skills. Another possibility is that team members who are already experienced builders take the lead during the prototyping phase, giving less skilled members fewer opportunities to practice.
We wanted to know whether the same pattern held across all four summits. Let’s take a closer look.
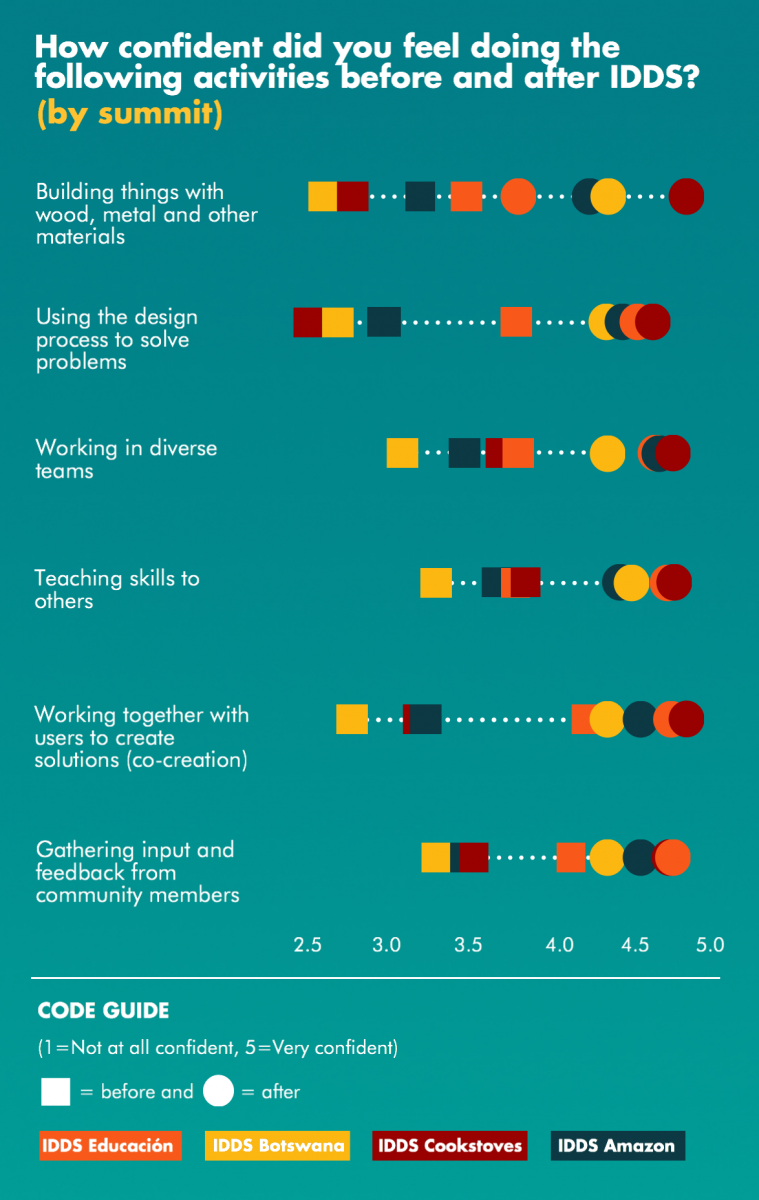
We notice differences from summit to summit, in both the degree of improvement and the skill areas.
For one, we see the most dramatic improvements overall at IDDS Cookstoves and IDDS Botswana, and the smallest improvements at IDDS Educación. Part of the latter pattern is that IDDS Educación participants assessed their confidence as quite high at baseline.
We also see some differences in the areas of most improvement. At IDDS Botswana, participants felt the most growth in their building abilities. At IDDS Amazon, participants reported the most improvement in using the design process. Perhaps unsurprisingly, at IDDS Educación, we saw the strongest improvement in teaching others.
We were also curious whether there were differences between men and women in terms of skill growth during the summit.
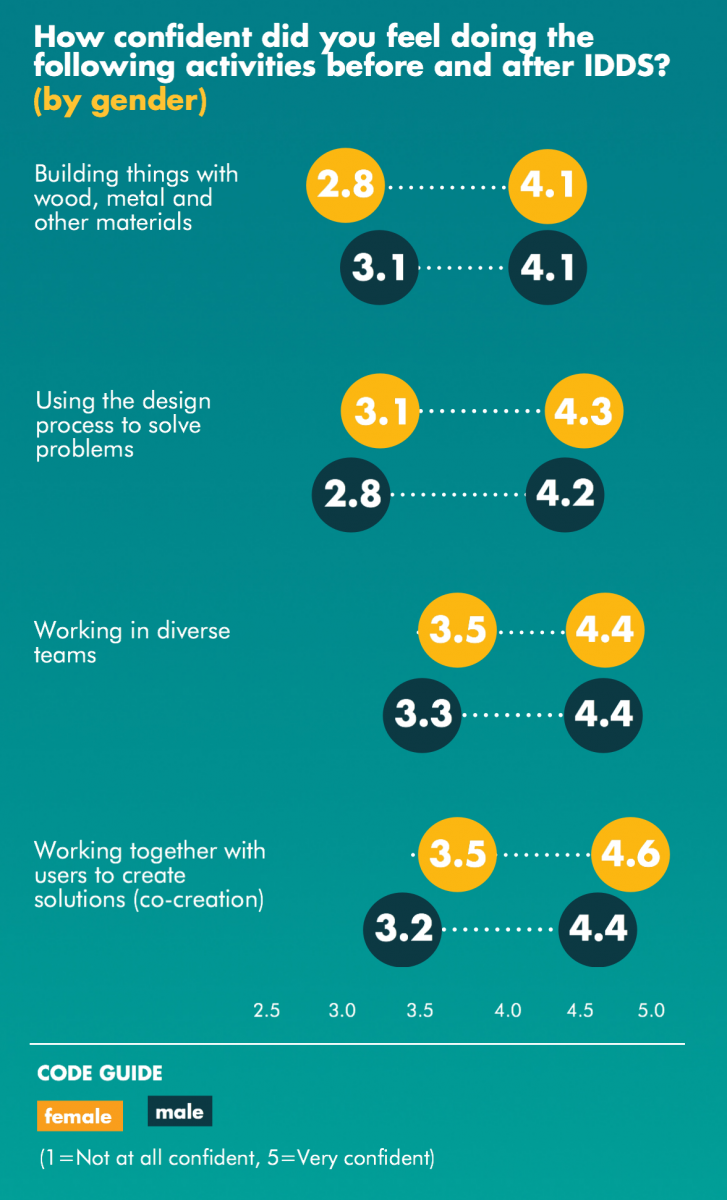
Here’s what I notice:
At the beginning, men self-rank as more confident than women at building. By the end of IDDS, the women catch up.
At the beginning, women self-rank as more confident than men at design, gathering community input, and working in diverse teams. By the end of IDDS, the men catch up.
The two groups progress equally on co-creation, but women had a slight edge at the beginning.
Especially in contexts where gender roles make it difficult for men and women to practice the same skills, IDDS aspires to level the playing field. The data suggests that IDDS succeeds at doing just that, at least when it comes to participants’ confidence.
What about the difference between local, national and international participants?
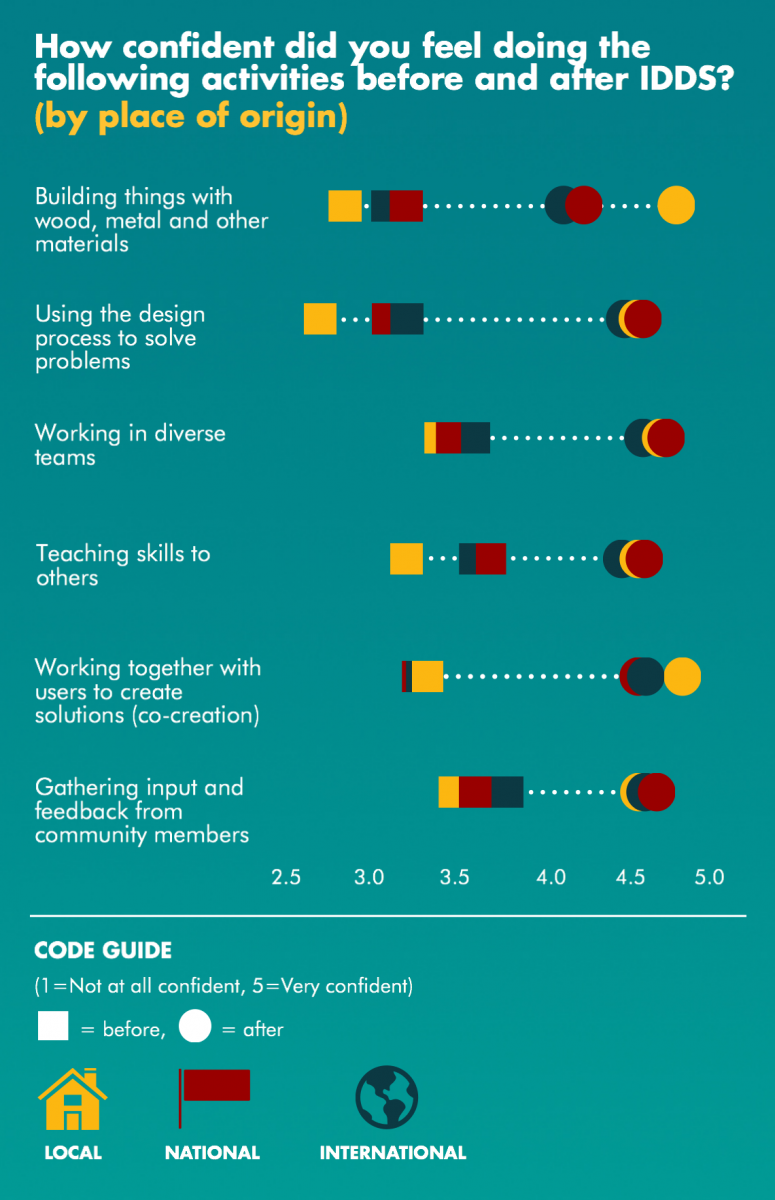
We see the most dramatic growth in skills for local participants, whereas the growth is more modest for both national and international participants.
One of the most interesting patterns here is when we look at the biggest gains for each group. Local participants improve the most in building, national participants improve the most in design, and international participants improve the most in co-creation. Happily, this aligns quite well with each group’s top priorities. It is also suggests two promising pathways toward long-term impact: if locals are equipped with building and design tools, then they are better able to solve the challenges in their communities. If experienced designers from afar discover the value of empathy and the importance of working together with users, then they are likely to carry on these values in their own work in other contexts.
Post-Script: Data geeks, read on!
This was our first attempt to collect this type of data at a summit, and we learned a few things.
Averages aren’t everything. Just because participants' confidence improves on average doesn’t mean that every participant feels more confident.
In fact, for each skill area, there are a substantial number of participants who report no change in confidence. For building, 35% of participants report no change in their confidence before and after the summit. For teaching, 44% report no change. Unsurprisingly, the participants who report no change tend to be those who already had high levels of confidence at the start of the summit.
And to really drive the point home, a handful of participants even report feeling less confident after IDDS! This is worth looking into more deeply: some participants may have had a negative experience in that topic, while others may have seen themselves as overconfident at the beginning.
Categories matter…and qualitative data helps. Many people have asked us why we chose this particular set of skills to test. Over the years, we’ve asked participants the open-ended question, “What skills or knowledge did you gain or develop during the summit?” These six areas represent the most common themes from their responses. We also consult with each summit’s instructor team to adjust and add to the list based on the content of that summit.
The IDDS curriculum is currently getting a tune-up, and through that process we’ve defined a standard set of IDDS learning objectives that we will test in 2017. This will allow us, for instance, to break down “Using the design process” into much more specific skills.
People change their mind. You may be wondering why all of this is post-survey data. In other words, why do we ask this question at the end in a retrospective way, instead of doing a pre-assessment and post-assessment?
The quick answer is that, actually, we do both. In the pre-survey, we ask participants to self-assess their level of confidence at that moment. Then in the post-survey, we ask them to reflect back to their pre-summit selves. We’ve chosen to share only the post-survey responses because, frankly, the data is better. You can read why here and here, or I’ll summarize:
One, people don’t remember what they wrote in their pre-survey. For example, let's imagine you came into the summit feeling fairly confident at building, and so you self-ranked as a 4 in the pre-survey. Then, you spent two long weeks honing your building skills. You’re feeling pretty confident and happy about your learning, but you’ve seen people even more skilled than you are, so you self-rank as a 4 in the post-survey. Even though you feel like you’ve improved, your pre and post scores would suggest that you didn’t learn anything.
Two, people tend to overestimate their skills at the beginning. Then, after going through an intense learning experience, people realize how little they knew at the start of the process. They adjust their “before” score downward. In other words, in the pre-survey, they “don’t know what they don’t know.”
In fact, I can prove it to you:
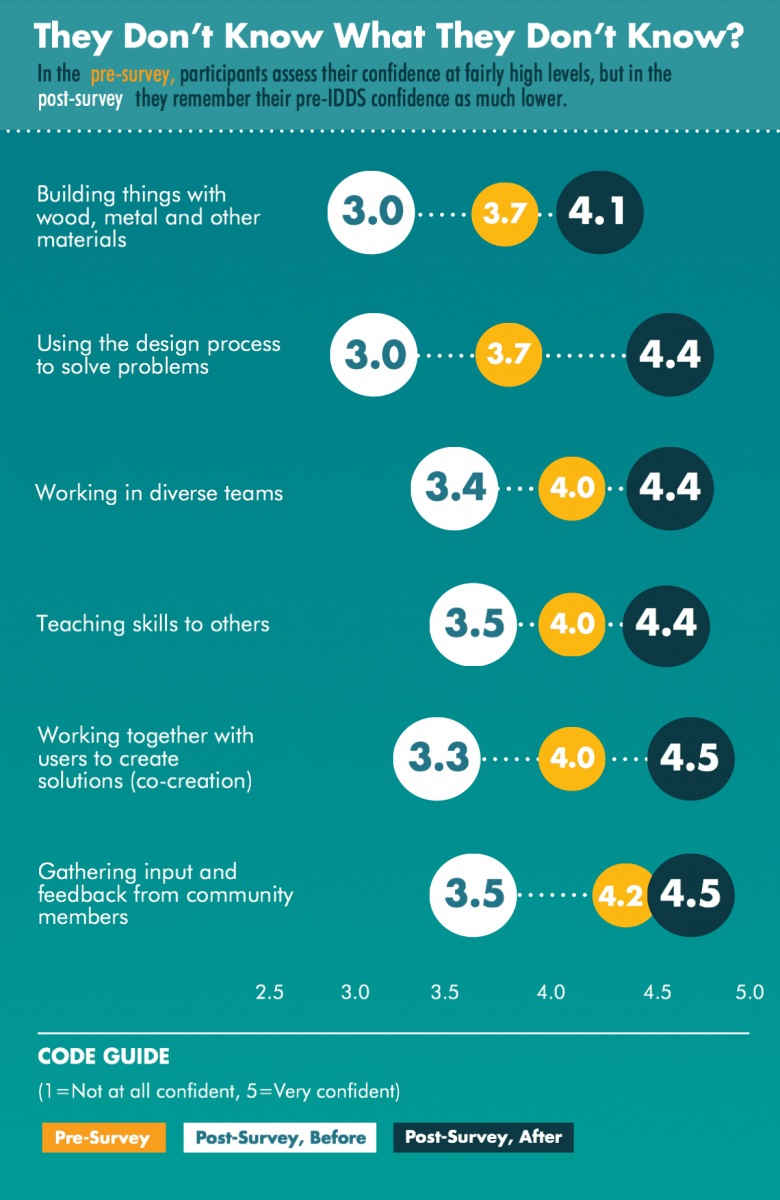
With just a simple pre-survey and post-survey approach, the data would have told us a completely different story, and we would have missed participants' full insight on how far they had come.
It takes a village to get good data! Many thanks to Josephine Ong for designing the infographics for this post. Also, thanks to M&E Fellows Tricia Johnson, Gayathri Ramani & Helena Tavares for collecting and crunching the data, and to David McDevitt for wrangling it together!